


The Story
On October 28, 2026, Wingstop reported results for its third quarter ended September 26. System-wide sales, meaning everything rung up at every Wingstop restaurant, franchised or company-owned, were $1.44 billion. That was up 6.0% from a year earlier. Wingstop’s own revenue rose 5.3%, to $185.1 million.
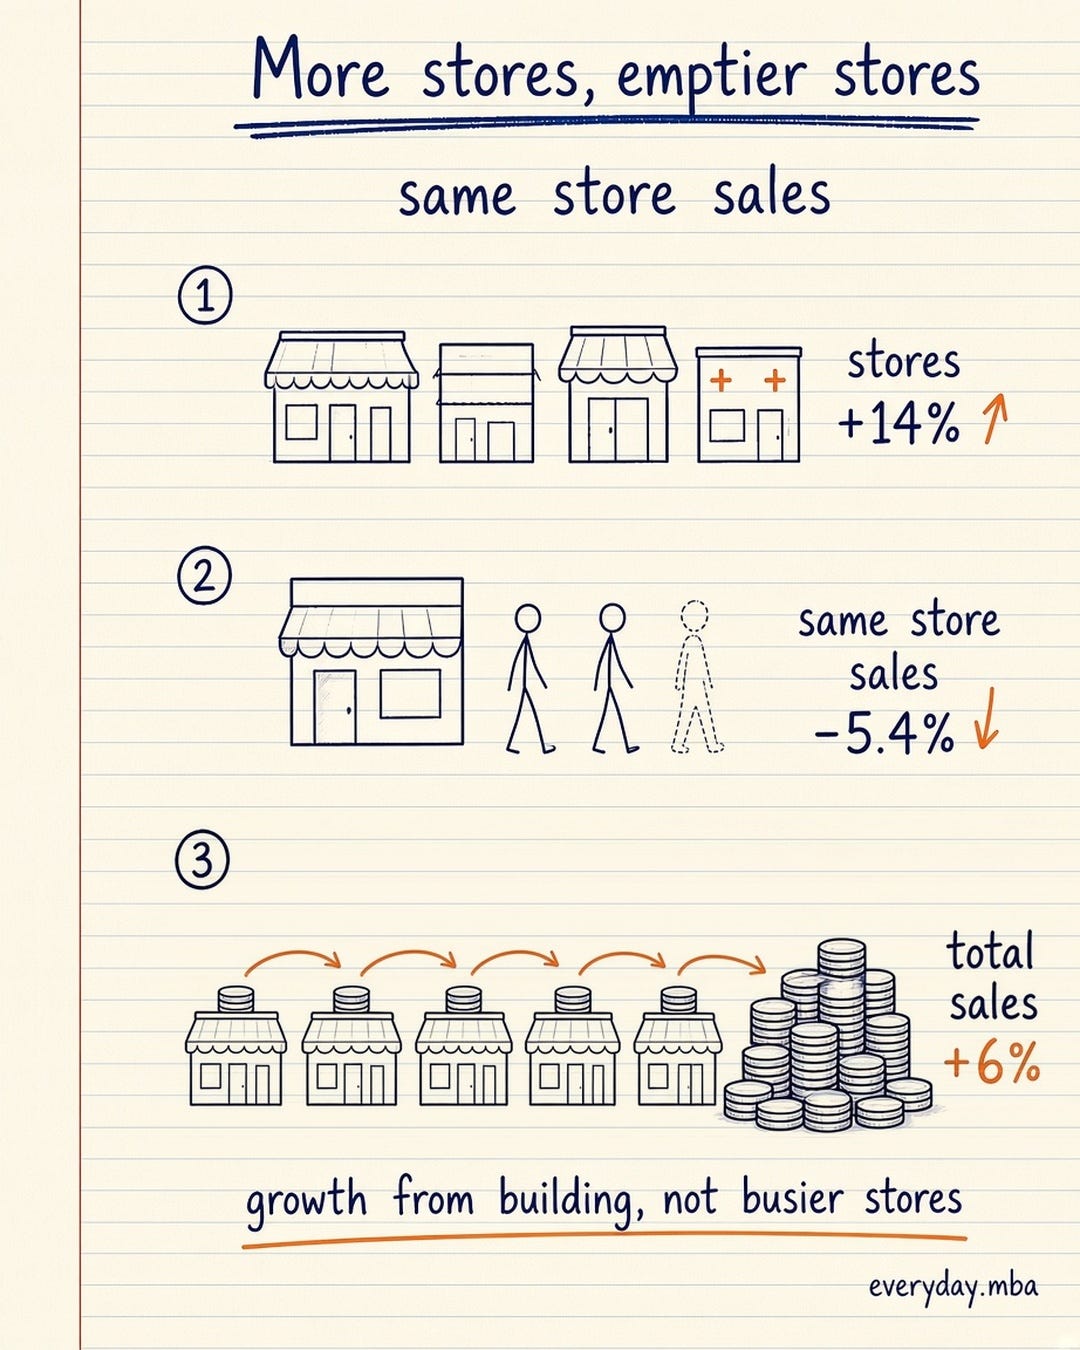
Then comes the other number. Domestic same store sales fell 5.4%. A year earlier they had fallen 5.6%. Wingstop said the drop came from fewer transactions, “reflecting continued pressure on consumer spending.”
So how do sales grow while sales at existing restaurants shrink? More restaurants. Wingstop ended the quarter with 3,331 locations, up from 2,932 a year earlier, about 14% more. It opened 76 net new ones in the quarter alone.
The average U.S. restaurant open at least a year now brings in about $1.85 million a year, down from $2.06 million. CEO Michael Skipworth said the company is “not satisfied” with the quarter. For the full year, Wingstop now expects same store sales to fall about 6.5% to 7% while it adds 440 to 450 new restaurants.
The Lesson
Same store sales (often called “comps,” or like-for-like sales) compare this year’s sales with last year’s at only the locations open in both periods. Wingstop counts restaurants open at least 52 full weeks. New openings and closed stores are left out on purpose.
That makes comps the cleanest read on demand. Total sales answer “how big did we get?” Comps answer “are our restaurants getting busier?” A chain can grow the first by building. It can only grow the second by getting more customers, or more money from each one.
Wingstop’s numbers show the gap. Restaurant count grew about 14%. Comps fell 5.4%. Together, total sales still rose about 6%. Its royalty income shows the same tug of war: Wingstop said new franchise restaurants added about $8.6 million, while the comps decline took away about $3.6 million.
Why should an investor care if total sales still grow? Because new stores are only worth building if each one earns enough to pay back its cost. When existing restaurants sell less, every new one is likely to open into weaker demand too. Lower sales also squeeze margins, since rent and much of the staffing don’t shrink with traffic. Wingstop said lower sales hurt it on “fixed labor costs and operating expenses” at its own restaurants.
For a franchisor, the pressure falls first on franchisees. Wingstop collects royalties on their sales either way. Franchisees pay the rent and wages. If their stores keep earning less, fewer will want to open more.
The catch is that comps can mislead too. Two weak years in a row stack up: a 5.6% drop followed by a 5.4% drop leaves the average older store selling roughly 11% less than two years ago. And comps can rise just from price increases while fewer people walk in. That’s why Wingstop says its comps are driven by two things: the number of transactions and the average transaction size.
How to Use It
1. Separate growth from expansion. When a chain reports sales growth, find the comps. If the store count grows faster than total sales, the average store is selling less.
2. Check transactions versus check size. Rising comps from higher prices with fewer visits is a warning, not a win.
3. Stack two years. Compare comps against a weak or strong prior year before calling a turnaround.
4. Follow the unit economics. Falling sales per store make every new opening less valuable, even if the store count keeps climbing.
5. Use it at work. Any business with locations, accounts, or customers can split growth into “more of them” and “more from each one.” Report both.
Sources
1. Wingstop Inc., “Wingstop Inc. Reports Fiscal Third Quarter Financial Results,” Exhibit 99.1 to Form 8-K, October 28, 2026 (SEC EDGAR). https://www.sec.gov/Archives/edgar/data/1636222/000162828026067723/a991wingearningsreleasedra.htm
2. Wingstop Inc., Form 8-K filing index, October 28, 2026 (SEC EDGAR). https://www.sec.gov/Archives/edgar/data/1636222/000162828026067723/0001628280-26-067723-index.htm