



The Story
On October 21, 2026, Meta Platforms, the company behind Facebook, Instagram, WhatsApp and Messenger, reported results for its third quarter ended September 30. Revenue rose 26% to $64.6 billion, from $51.2 billion a year earlier. Almost all of it came from ads: advertising revenue was $63.1 billion, up from $50.1 billion.
Most of the headlines went elsewhere. Operating income fell 37% because of a $9.89 billion charge tied to an agreement with state attorneys general to resolve litigation, and Meta announced a new class of non-voting stock. Those are real stories. But the most useful lesson sits in three short bullet points in the release.
Meta breaks its ad business into two pieces: how many ads it showed, and what it got paid for each one. This quarter, ad impressions grew 10% and the average price per ad grew 14%. The number of people using Meta’s apps each day grew 3%, to 3.64 billion.
Now look at the same quarter a year earlier. In the third quarter of 2025, revenue also grew 26%. But the mix was the reverse: ad impressions grew 14%, average price per ad grew 10%, and daily users grew 8%.
Same headline growth, two years running. A different engine underneath. In 2025, Meta grew mostly by showing more ads to more people. In 2026, it grew mostly by getting paid more for each ad, while its audience grew much more slowly. Meta says its AI investments are delivering more ad revenue through stronger engagement, better recommendations and more efficient monetization.
The Lesson
Revenue is volume times price. Every growth number can be split into those two parts, and the split tells you more than the total.
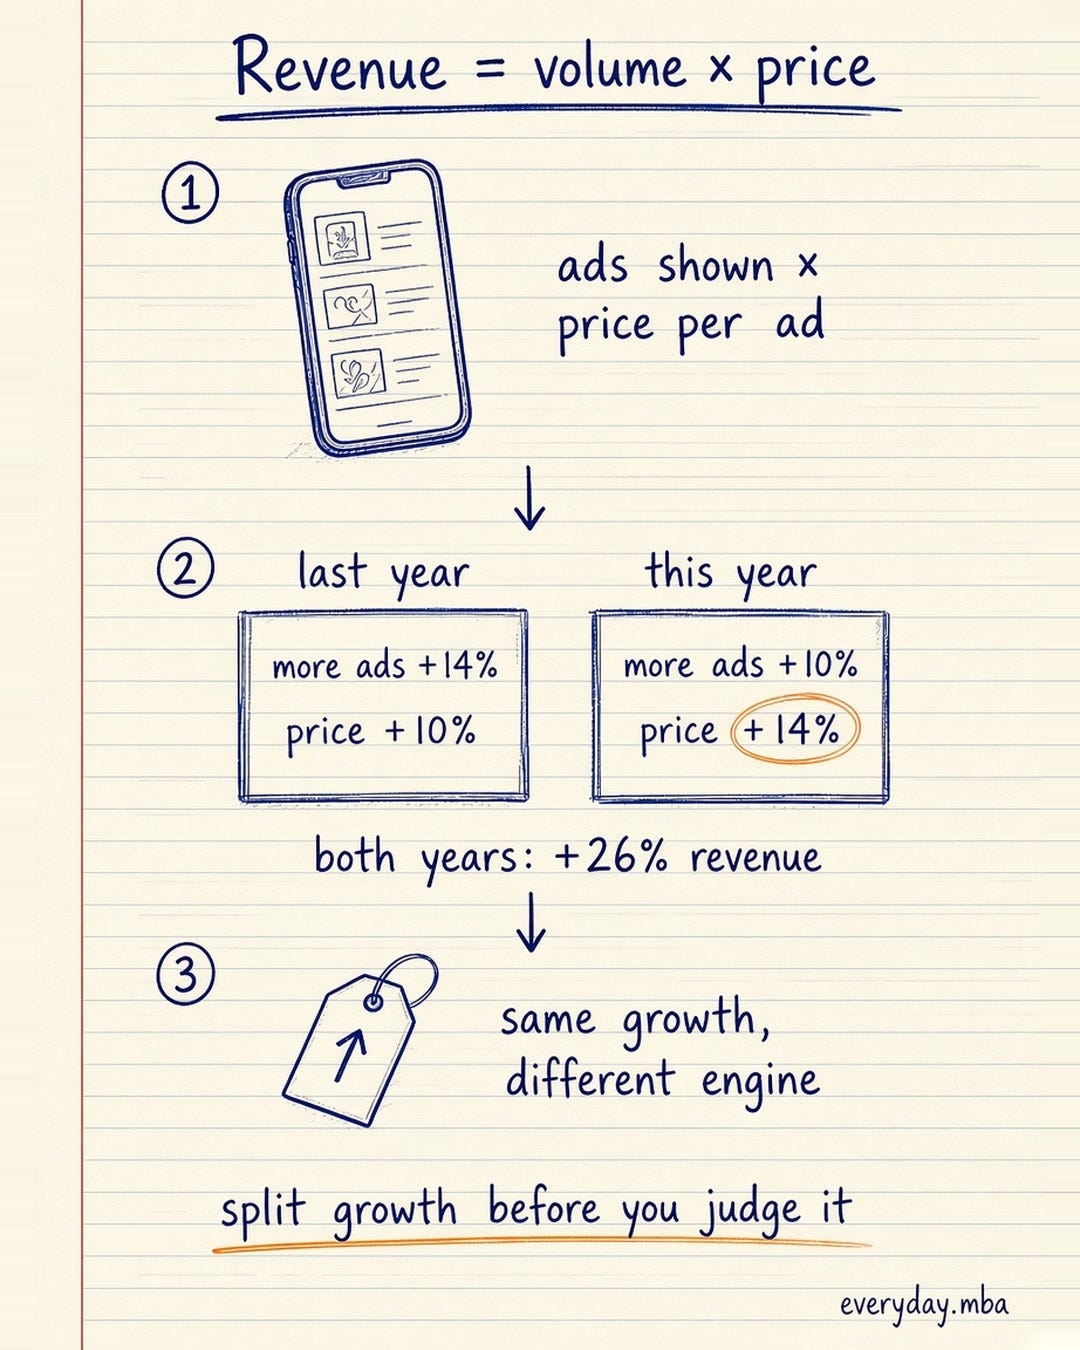
The math works roughly by multiplication. Ten percent more ads at 14% higher prices is 1.10 times 1.14, or about 25% more revenue. That’s close to the 26% Meta reported for ad revenue. The small gap is just rounding, because Meta reports each piece to the nearest whole percent.
You can split volume further. Meta’s impressions grew 10% while daily users grew 3%, so the average person saw roughly 7% more ads. That gives three levers: more people, more ads per person, and a higher price per ad.
Each lever has a different ceiling. New users get harder to find when you already reach 3.64 billion people a day. Ads per person can only rise so far before the feed feels cluttered. Price can keep rising only if advertisers keep getting results worth paying for, which means better targeting and better measurement, not just more demand.
That’s why the mix matters to investors. Two companies growing 26% can have very different futures. One may be adding customers. The other may be raising prices on the customers it already has. Neither is good or bad by itself, but they wear out in different ways.
How to Use It
1. Split every growth number. When a company reports revenue growth, look for the volume and price pieces: units and average selling price, subscribers and revenue per subscriber, rooms and rate per room. Many companies disclose them.
2. Compare the mix to last year. One year of data tells you the size of growth. Two years tell you whether the engine changed. Meta’s total stayed at 26% while its drivers swapped places.
3. Ask what’s behind the price. A higher price can mean more value delivered, more demand, a richer product mix, or just a price hike. Each has a different shelf life.
4. Watch the volume ceiling. When the customer base is already huge, growth has to come from more use per customer or a higher price. Know which one a business is leaning on.
5. Use it on your own numbers. If your team’s sales rose 10%, break it down: more customers, bigger orders, or higher prices? The answer tells you where to put next quarter’s effort.
Sources
1. Meta Platforms, “Meta Reports Third Quarter 2026 Results,” news release with financial tables, October 21, 2026. https://investor.atmeta.com/investor-news/press-release-details/2026/Meta-Reports-Third-Quarter-2026-Results/default.aspx
2. Meta Platforms, Form 8-K (Items 1.01, 2.02, 8.01 and 9.01), filed October 21, 2026 (SEC EDGAR). https://www.sec.gov/Archives/edgar/data/1326801/000162828026066700/0001628280-26-066700-index.htm
3. Meta Platforms, Exhibit 99.1 to Form 8-K (third quarter 2026 earnings release, including segment revenue), filed October 21, 2026 (SEC EDGAR). https://www.sec.gov/Archives/edgar/data/1326801/000162828026066700/meta-09302026xexhibit991.htm
4. Meta Platforms, “Meta Reports Third Quarter 2025 Results,” news release, October 29, 2025. https://investor.atmeta.com/investor-news/press-release-details/2025/Meta-Reports-Third-Quarter-2025-Results/default.aspx