



Reported growth tells you how much bigger a company got. Organic growth tells you how much more its existing business sold, and the gap between the two is where the good questions start.
The Story
On October 15, 2026, Marsh, the global insurance broker and consulting firm formerly known as Marsh McLennan, reported results for its third quarter ended September 30. Revenue rose 8% to $6.86 billion, up $512 million from $6.35 billion a year earlier. Adjusted earnings per share rose 10% to $2.03, and GAAP earnings per share were $1.69, up from $1.51.
The first line of the press release carried two growth numbers, not one: “Revenue Growth of 8%; Underlying Revenue Growth of 5%.”
Marsh’s own reconciliation shows where the gap comes from. It strips out the effect of currency moves and of acquisitions, dispositions and certain other items from both years. Do that, and comparable revenue went from $6.34 billion to $6.66 billion, a gain of $316 million, or 5%. Of the rest of the $512 million, about $190 million came from acquisitions and other items, and currency added only about $6 million.
One of those “other items” is worth a closer look. During the quarter, Marsh bought the remaining 60% of Deasterra Partners, a firm it already partly owned. When it did, it marked the stake it already held up to fair value, and that produced a $126 million gain that is counted as revenue in the income statement. Marsh leaves it out of underlying revenue. No client paid that $126 million.
The segments tell the same story. In Marsh Risk, the region covering Europe, the Middle East and Africa grew 22% as reported but 7% on an underlying basis; 16 points came from acquisitions and other items. Reinsurance had nothing to lean on: revenue fell 6% on both bases. Management Consulting grew 14% on both bases, with little help from deals. Investing.com reported that the shares rose about 2% after the release.
The Lesson
Reported revenue growth answers “how much bigger did the company get?” Organic growth, which Marsh calls underlying growth, answers a harder question: “how much more did the same business sell this year than last?” To get there, you remove three things: revenue from businesses bought or sold since last year, the effect of exchange rates, and one-time items that aren’t really sales.
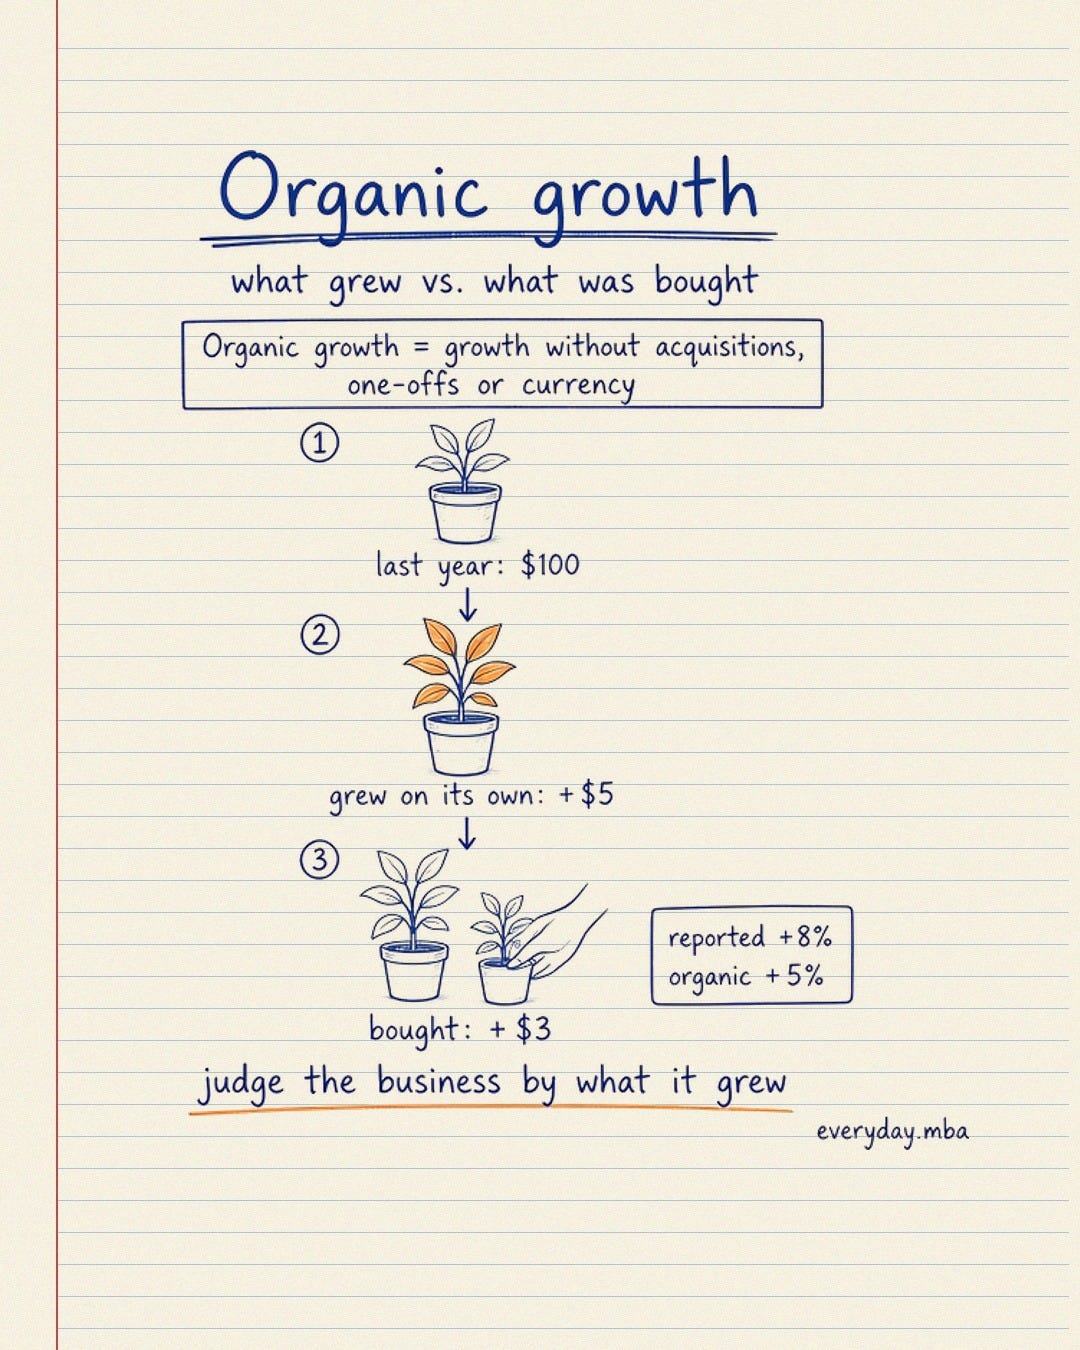
Why does it matter? Because growth you buy is not the same as growth you earn. An acquisition adds revenue on day one, but you paid for it, often with cash, debt or shares, and next year it’s just part of the base. Organic growth is the part that keeps coming without writing a new check. It’s the best read on whether customers want more of what the company sells, whether prices are holding, and whether the sales team is winning.
That doesn’t make acquisitions bad. A good deal can be a smart use of cash, and acquired revenue still pays the bills. The point is to judge each kind of growth on its own terms. A company growing 8% with 5% organic growth is a 5% grower that is also a buyer. Judge the buying by what it costs and what it returns, and judge the business by the 5%.
One caution: “underlying” is a non-GAAP measure. Each company defines its own version, and the definitions vary. Marsh publishes a line-by-line reconciliation from reported to underlying revenue, and that table is the first thing to look for.
How to Use It
1. Find both growth numbers. Companies that buy other businesses often report organic, underlying or “comparable” growth next to reported growth. If the headline gives you only one number, ask why.
2. Break the gap into pieces. Acquisitions, currency and one-time items each tell a different story. Marsh’s 3-point gap this quarter was almost all acquisitions and other items; currency barely moved the needle.
3. Look for accounting gains inside revenue. A remeasurement gain like Marsh’s $126 million can sit right in the top line. It follows the rules, but it won’t repeat.
4. Check the segments. A region growing 22% and a unit shrinking 6% can average out to a fine-looking total. Find out which units grow on their own and which need deals.
5. Use it in your own work. Whether you run a team or a business, separate growth from your existing customers and products from growth you bought. Set goals on the organic number, because it’s the one you’ll have to repeat next year.
Sources
1. Marsh & McLennan Companies, Inc. (Marsh), “Marsh reports third quarter 2026 results,” news release with financial tables, October 15, 2026. https://www.marsh.com/content/dam/mmc-web/files-for-download/investors/2026/pdf-marsh-investors-3q-news-release-2026.pdf
2. Marsh & McLennan Companies, Inc., Form 8-K (Items 2.02 and 9.01), filed October 15, 2026 (SEC EDGAR). https://www.sec.gov/Archives/edgar/data/62709/000006270926000256/0000062709-26-000256-index.htm
3. Marsh & McLennan Companies, Inc., Exhibit 99.1 to Form 8-K (third quarter 2026 news release), filed October 15, 2026 (SEC EDGAR). https://www.sec.gov/Archives/edgar/data/62709/000006270926000256/mmc3q2026ex991newsrelease.htm
4. Investing.com (via Yahoo Finance), “Marsh shares rise 2% after beating third quarter estimates on strong revenue growth,” October 15, 2026. https://finance.yahoo.com/markets/stocks/articles/marsh-shares-rise-2-beating-113947505.html