


The Story
On October 29, 2026, Hershey reported results for its third quarter ended September 27. Total net sales were $3.28 billion, up 3.0% from a year earlier. Strip out the LesserEvil snack brand it bought in 2025 and currency moves, and sales grew just 0.8%.
That small number hides two big moves pulling in opposite directions. Hershey’s prices added about 11 points of growth. Its volume took away about 10 points. Hershey said the volume drop reflected “elasticity impacts” in its North American candy business and overseas, plus shipment timing and products it chose to cut abroad.
The North America Confectionery segment, which sells the chocolate and candy most people know, shows it most clearly. Prices added about 13 points. Volume fell about 11 points. Net sales rose 1.6%, to $2.66 billion.
Profit told a different story. The segment earned $950 million, up 66.2% from $571 million a year earlier. Its margin jumped from 21.8% of sales to 35.8%. Hershey also said consumers are growing “more cautious,” and its share of U.S. candy, mint and gum sales fell over the latest 12 weeks.
The Lesson
Price elasticity measures how much buyers pull back when a price goes up. Divide the percent change in quantity by the percent change in price. If prices rise 10% and volume falls 10%, elasticity is about 1. Below 1, demand is “inelastic”: people grumble but mostly keep buying. Above 1, it’s “elastic”: they walk.
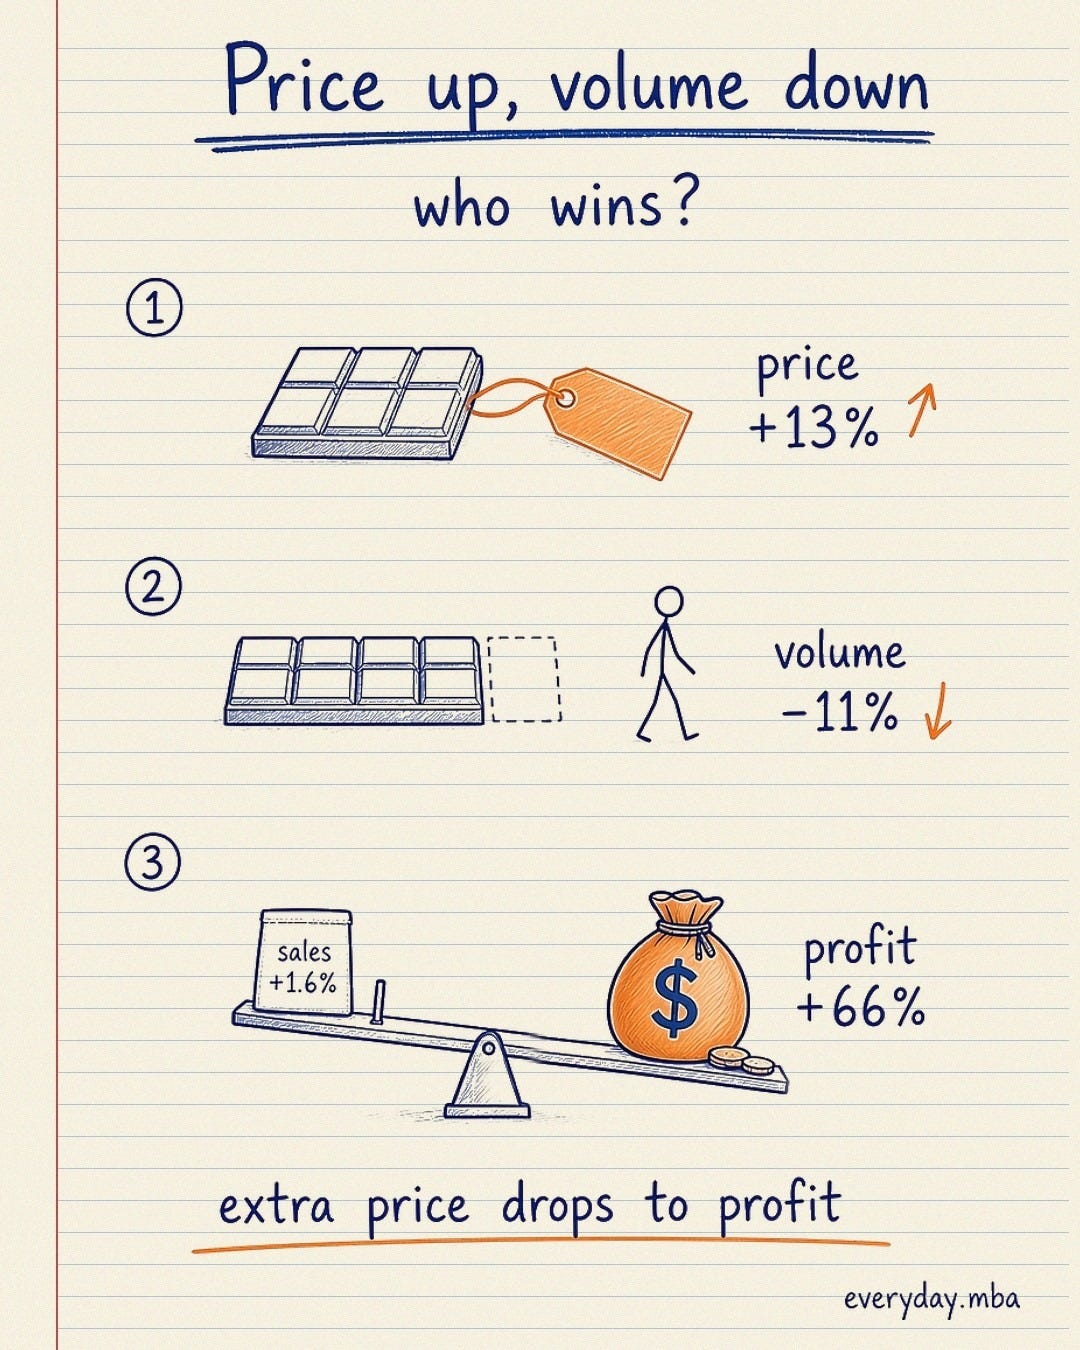
Hershey’s candy numbers give a rough read. Volume fell about 11 points while prices rose about 13. That’s roughly 11 divided by 13, or about 0.85. It’s only a rough figure, since Hershey said shipment timing also moved volume. But it says this: for every 1% of price, Hershey gave up a bit less than 1% of volume.
Here’s the part people miss. With elasticity near 1, sales barely move. So why did profit jump? Because price and volume don’t hit profit the same way.
Extra price on every bar mostly drops to profit; the bar didn’t cost more to make because you charged more for it. Lost volume only costs you the margin on the bars you didn’t sell. You also save the cocoa, sugar, packaging and freight those bars would have used. Charge more, sell a little less, and the remaining sales carry much more profit.
In dollars, segment sales rose about $41 million while segment profit rose about $378 million. Price wasn’t the only driver. Hershey also credited lower commodity costs, productivity savings and tariff refunds. But the price-versus-volume trade sat in the middle of it.
The catch is time. Elasticity measured over one quarter can look gentle. Over years, customers find substitutes, try store brands and change habits. Losing market share is the early warning, and Hershey just reported some. That’s likely why it raised advertising spending 17.1% in the quarter: it’s trying to win back buyers without giving the price back.
How to Use It
1. Split growth into price and volume. Companies often report both. Flat sales can hide a big price rise and a big volume drop.
2. Estimate elasticity. Divide the volume change by the price change. Below 1, a price rise lifts revenue. Even near 1, it can lift profit.
3. Follow it to profit, not just sales. Price mostly falls to profit. Lost volume only costs its margin. Run both through your margins before deciding.
4. Watch share and habits. Slipping market share is the first sign that short-run elasticity is turning into long-run loss.
5. Use it on your own prices. Before a raise, ask how many customers you can lose and still make more money. Then watch who actually leaves.
Sources
1. The Hershey Company, “Hershey Reports Third-Quarter 2026 Financial Results,” news release, October 29, 2026. https://www.thehersheycompany.com/en_us/home/newsroom/press-release/2026-10-29-Hershey-Reports-Third-Quarter-2026-Financial-Results.html
2. The Hershey Company, Form 8-K, filed October 29, 2026 (SEC EDGAR). https://www.sec.gov/Archives/edgar/data/47111/000162828026068046/0001628280-26-068046-index.htm
3. The Hershey Company, Exhibit 99.1 to Form 8-K (third-quarter 2026 earnings release, including net sales components and segment results), filed October 29, 2026 (SEC EDGAR). https://www.sec.gov/Archives/edgar/data/47111/000162828026068046/exhibit991_2026xq3.htm