


The Story
On October 22, 2026, American Airlines Group reported results for its third quarter ended September 30. Revenue hit a third-quarter record of $16.3 billion, up 19.3% from a year earlier. Premium revenue rose 22.9%, and revenue from managed corporate travel rose 27.6%.
Yet the quarter ended in the red. American posted a net loss of $269 million. Operating income, the profit from running the airline before interest and taxes, fell to $115 million from $151 million. Its operating margin slipped to 0.7% from 1.1%.
The reason was fuel. American paid an average of $3.85 a gallon, up from $2.37 a year earlier. It burned 3.0% more fuel, and fuel expense rose $1.9 billion, or 67.5%, to $4.6 billion.
Airlines track their business one seat mile at a time. One available seat mile is one seat flown one mile, whether or not someone is sitting in it. American flew 80.7 billion of them this quarter, 4.2% more than a year earlier.
For each of those seat miles, American took in 20.25 cents of revenue, up 14.5% from 17.69 cents. That’s a big jump. But its cost for each seat mile rose even faster, by 14.9%, to 20.10 cents from 17.49 cents.
The Lesson
Unit economics means looking at one unit of what a business sells, and comparing what it earns on that unit with what it costs. The gap between the two, the unit spread, is what profit is made of.
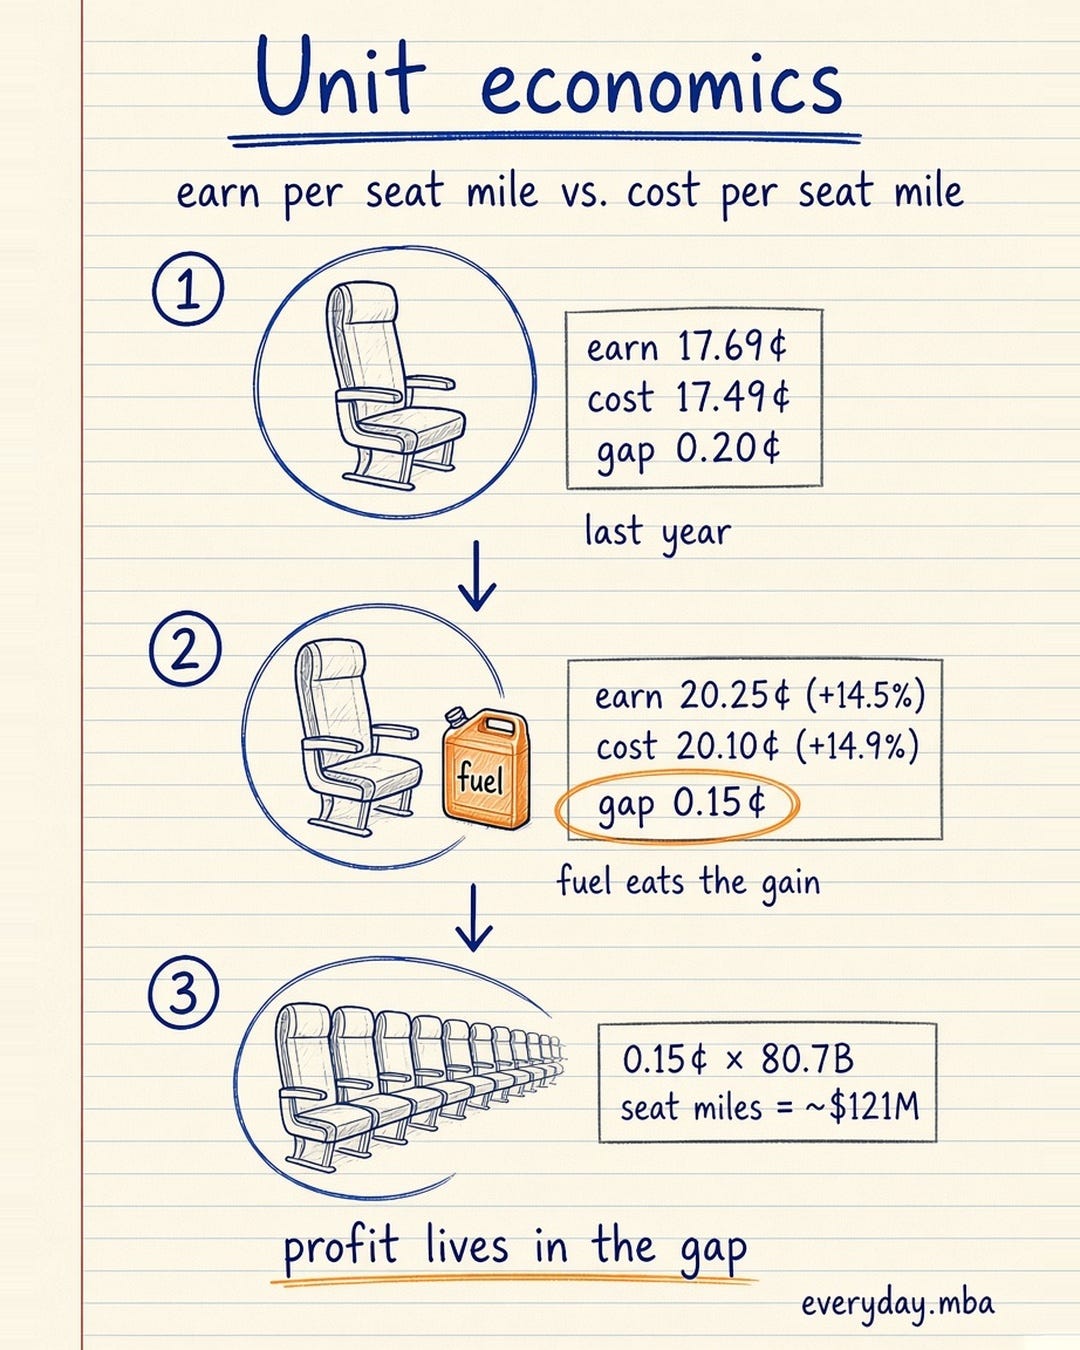
American’s spread was 0.20 cents per seat mile a year ago (17.69 minus 17.49). This quarter it was 0.15 cents (20.25 minus 20.10). Multiply 0.15 cents by 80.7 billion seat miles and you get about $121 million, close to the $115 million of operating income American reported. The small difference is rounding. A fraction of a cent, repeated billions of times, is the whole business.
That’s why revenue growth alone can mislead. American earned 2.56 cents more per seat mile than a year ago. Its costs per seat mile rose 2.61 cents. Fuel alone went from 3.58 cents to 5.74 cents, an increase of 2.16 cents. That single cost ate most of the revenue gain.
So airlines also report a second cost number, CASM-ex: cost per seat mile excluding fuel, special items and profit sharing. American’s CASM-ex rose 3.0%, to 14.34 cents from 13.92 cents. American leaves fuel out because it has no control over fuel prices, so this number tracks its non-fuel costs, such as labor, maintenance, and airport rent and landing fees.
Both numbers are useful, and they answer different questions. CASM-ex tells you whether management is running the airline efficiently. Total cost per seat mile tells you whether the airline is making money. Fuel is excluded from the first number, but American still has to pay for it.
The outlook shows the same squeeze. For the fourth quarter, American expects revenue to grow 19.5% to 22.5%. It also expects fuel to average about $4.70 a gallon and fuel expense to rise about $2.8 billion. It projects an adjusted loss of $0.50 to $1.10 per share.
How to Use It
1. Find the unit. Every business has one: a seat mile, a room night, a subscriber, an order. Revenue and cost per unit tell you more than totals do.
2. Watch the spread, not just revenue. Revenue per unit rising 14.5% sounds great. If cost per unit rises 14.9%, the business is earning less on each unit.
3. Read “ex” metrics with care. Cost measures that exclude a big expense show how well management controls what it can. But the excluded cost is still real, and the full cost per unit decides profit.
4. Do the multiplication. A thin spread times huge volume can explain a whole income statement. It also shows how little room there is when one cost jumps.
5. Use it on your own numbers. Pick your unit (a customer, a job or a product) and write down what you earn and what it costs. If a key input cost rises, you’ll see how much price you need to stay even.
Sources
1. American Airlines Group, “American sets new revenue records amid historic fuel cost pressure,” news release, October 22, 2026. https://news.aa.com/news/news-details/2026/American-sets-new-revenue-records-amid-historic-fuel-cost-pressure-CORP-FI-10/default.aspx
2. American Airlines Group, Form 8-K, filed October 22, 2026 (SEC EDGAR). https://www.sec.gov/Archives/edgar/data/6201/000000620126000064/0000006201-26-000064-index.htm
3. American Airlines Group, Exhibit 99.1 to Form 8-K (third quarter 2026 earnings release, including operating statistics and CASM reconciliation), filed October 22, 2026 (SEC EDGAR). https://www.sec.gov/Archives/edgar/data/6201/000000620126000064/a8kerexhibit991q3-26.htm